Introduction: Why does this indicator matter for Egyptian market participants?
In a market like the Egyptian Exchange, investors and market followers need tools that help them read a stock’s broader direction without getting lost in daily noise and short-term price swings. This is where the Simple Moving Average (SMA) becomes useful. It is one of the most widely used basic tools in technical analysis for understanding whether a stock is moving in an upward trend or not.
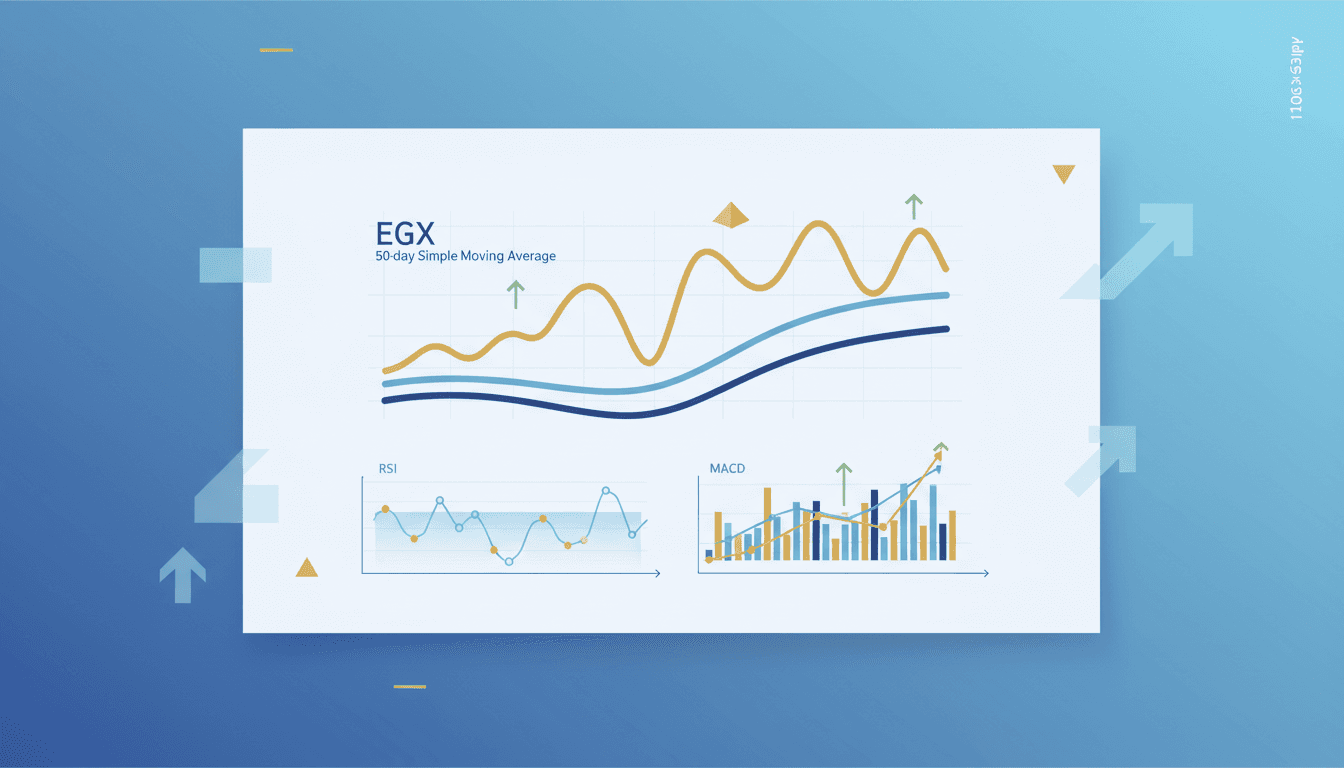
Among the different moving averages, the 50-day SMA receives particular attention because it is often used as a practical reference for assessing the medium-term trend, and it is frequently viewed as an important support line. The core idea is straightforward: if a stock is trading above its 50-day moving average, that is generally seen as a sign of an upward trend.
What is the Simple Moving Average?
The Simple Moving Average is a tool that calculates the average price of a stock over a specific number of sessions. This average then moves forward day by day as new data enters the calculation and older data drops out. Its purpose is to smooth price movement so that the underlying trend becomes easier to see.
Put simply, instead of focusing on every daily rise and decline, the moving average gives you a calmer view of price action and helps answer an important question: Is the stock generally trending higher or not?
When we refer to the 50-day SMA, we mean the average price movement over the last 50 trading sessions. That makes it less about immediate fluctuations and more about the stock’s direction over a relatively intermediate period.
Why is the 50-day SMA often seen as a support line?
When a stock trades above its 50-day moving average, it effectively means that the current price is stronger than its average movement over the prior period. For that reason, many market participants view this average as a support area, meaning a level where the stock may find some stability if it pulls back from higher levels.
That does not mean the line will always prevent a decline. Rather, it serves as a technical reference point that traders and investors watch closely. If the stock remains above it, that may reflect continuation of the upward trend. If it breaks below it clearly, that may indicate relative weakness in the trend, or at least a loss of prior momentum.
How is it used in practice?
The 50-day SMA can be used in a simple and structured way:
1. Identifying the broader trend
If the price is above the 50-day SMA, that is a common technical sign that the trend is tilted upward. If the price is below it, that may suggest weaker trend conditions or the absence of a clearly rising path.
2. Watching how price behaves around it
In some cases, a stock pulls back toward the 50-day SMA and then stabilizes or rebounds. That behavior may support the view that the average is acting as a support area. If the price approaches it and then slips below it easily, that may suggest the support was not holding at that moment.
3. Using it as a framework, not a final verdict
A moving average does not tell you everything, but it helps organize the chart. It does not define business quality, company strength, or fair value on its own. What it does offer is a disciplined way to read price behavior within a technical framework.
A simple illustrative example
Imagine a stock that has been trading above its 50-day SMA for some time, and each time it approaches that average it stabilizes and resumes moving higher. In that case, the moving average can be understood as a support line that the market is respecting, while the stock’s ability to remain above it reinforces the reading of an upward trend.
By contrast, if the stock starts trading below that average after a period of staying above it, that may be a signal worth monitoring, because it could mean the upward momentum is no longer as strong as before.
This example does not imply the same outcome every time, but it shows how a technical analyst may think when using this indicator.
When is this signal useful?
The 50-day SMA tends to be more useful in the following situations:
- When the goal is to understand the broader trend rather than focus on one day’s move.
- When an investor or market follower wants to reduce the impact of daily noise on chart reading.
- When the tool is used within a disciplined process rather than emotional decision-making.
- In a market like the Egyptian Exchange, where weaker liquidity can sometimes affect the clarity of price action, a moving average may help provide a relatively calmer read on the trend.
When can it be misleading or insufficient on its own?
Despite its usefulness, the 50-day SMA is not immune to false or incomplete signals.
1. Because it is a lagging indicator
A moving average is based on past prices, so it does not lead the move; it follows it. That means the signal may appear only after part of the move has already happened.
2. During sideways trading
If a stock is moving in a sideways range without a clear trend, it may move above and below the average multiple times. In that case, the signal becomes less reliable and more vulnerable to noise.
3. When used in isolation
Relying on the moving average alone can lead to an incomplete reading. In the Egyptian market in particular, it is often more useful to combine more than one tool or analytical angle, such as price behavior itself, support and resistance levels, and disciplined observation, rather than building a full view on a single line on the chart.
Common mistakes beginners make
1. Treating the moving average as an unbreakable barrier
Some beginners assume the 50-day SMA will always act as support. That is not correct. It is an important level to monitor, not a guarantee.
2. Looking only at whether price is above or below it
The position of price relative to the average matters, but what matters more is how price behaves around that level. Is there stability? Is the level being respected? Or is the movement choppy and unclear?
3. Ignoring market structure and liquidity
In some situations, price action may be less orderly because of weak liquidity or volatility, which can make technical signals less dependable if interpreted mechanically.
4. Using the indicator without context
The moving average is a supporting tool, not a substitute for reading the broader context. It is a mistake to turn it into a rigid rule without looking at the bigger picture.
5. Confusing simplicity with superficiality
The fact that the indicator is easy to understand does not mean it should be used superficially. A simple tool can be highly effective when used with discipline, and misleading when used mechanically.
How can it help investors and market followers in practice?
For someone interested in the Egyptian Exchange, the 50-day SMA can be viewed as a first-step tool for answering three practical questions:
- Is the stock in an upward trend or not?
- Is it still trading above a level that many consider technical support?
- Does the chart support continued monitoring, or does it call for greater caution?
These questions do not produce an automatic decision, but they help build a more organized and less impulsive market reading.
Practical takeaway
The 50-day Simple Moving Average is one of the simplest and most important tools in technical analysis for understanding trend. If a stock is above it, that is generally seen as a sign of an upward trend, and the line is often viewed as an important support level. But its real value appears when it is not used alone, and instead combined with price behavior, awareness of market conditions, and disciplined interpretation.
In short: do not treat the 50-day SMA as a final answer. Treat it as a tool that helps you ask the right questions and read trend with greater clarity.